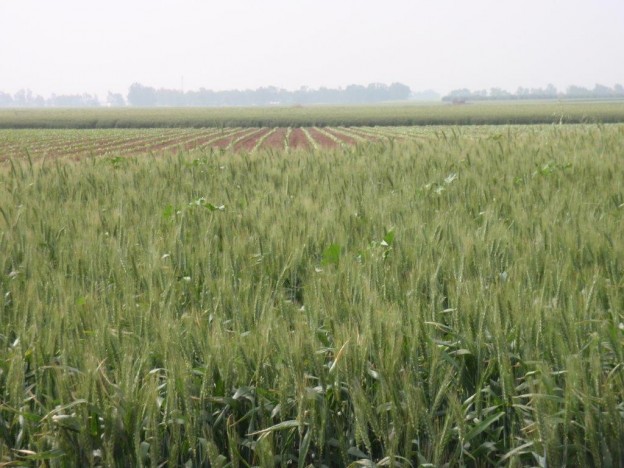
Analysis of trends in the international grain market

Billions of people throughout the world are improving their diet and seeking to incorporate more natural products and fewer grains into their diets. This trend is expected to continue as there are still significant differences between food consumption patterns in the developing world compared to developed countries.
Those in the grain value chain are currently at a strategic point in the lifecycle of an industry that will likely experience deficiencies in the foreseeable future. These include grain farmers and livestock owners, and especially dairy farmers who must assume that the cost of their most significant input, namely food, will increase dramatically and reach critical levels.
The target price of milk in Israel is adjusted based on input prices, though with a delay. The result is that the dairy farmers who can profit are those that can produce the majority of the food that they need and cope with fluctuations. Dairy farmers who do not streamline their food production processes will face increasing difficulties and will have no choice but to deplete their own capital in order to survive.
Table 1 – Milk Supply, 1990 , 1,000 MT
| Production | Import | Stock Variety | Export | Total | kg/year Per Capita Supply | |
| China | 7,037 | 1,211 | 0 | 102 | 8,146 | 5.9 |
| South Korea | 1,754 | 52 | 0 | 0 | 1,806 | 19.3 |
| Vietnam | 60 | 33 | 0 | 1 | 93 | 1.4 |
| Japan | 8,189 | 2,002 | 0 | 1 | 10,190 | 78.0 |
| Western Europe | 80,525 | 15,352 | -201 | 28,204 | 67,471 | 251.7 |
Table 2 – Milk Supply, 2011, 1,000 MT
| Production | Import | Stock Variety | Export | Total | kg/year Per Capita Supply | |
| China | 41,803 | 5,589 | 6 | 344 | 47,054 | 31.5 |
| South Korea | 1,873 | 1007 | 0 | 11 | 2,869 | 26.4 |
| Vietnam | 377 | 1001 | 0 | 11 | 1,367 | 15.1 |
| Japan | 7,474 | 1,865 | 0 | 7 | 9,333 | 71.2 |
| Western Europe | 78,359 | 22,377 | -613 | 42,397 | 57,726 | 261.1 |
Categories
Market Analysis