The Statistical Atlas of Israeli Agriculture

The Statistical Atlas of Israeli Agriculture summarizes the economic history of various agricultural sectors and enables data analysis that explains the agricultural business environment and facilitates decision-making processes. The atlas was first established by Prof. Yoav Kislev, and Zenovar had the privilege of updating it with Prof. Kislev.
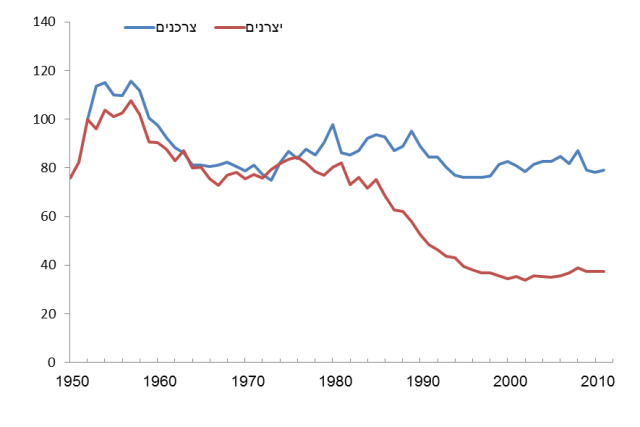
One example of a finding from the atlas is the graph below, which presents the food cost price index for consumers in Israel, with inflation deducted, compared with the price index that the farmers received for the produce, with inflation deducted. This shows that until the late 1970s, progression of these indices coincided with one another.
A gap began to form during the late 1970s. Farmers lost approximately half of their revenue, while the consumers gained nothing. Food prices for the Israeli consumer (inflation deducted) have remained stable for nearly 40 years, while during this period the farmers absorbed 50% cutbacks. Although the exchange rate had a negative impact on the farmers’ intake, the main problem was that something came between the farmers and consumers during the last 40 years and took their profits. It is, in fact the food processing companies and supermarket chains that erode the farmer’s income and come between them and their end consumers. This occurs when only a few intermediate companies mediate between millions of dissociated consumers and 15,000 dissociated farmers.
Consumer food price index compared to agricultural produce price index for farmers
So how do farmers survive?
The cutback in prices since the 1980s was severe enough to destroy any industry, but Israeli agriculture has a long history of creating something from nothing, transforming shortage into an advantage, and understanding that failure in not an option. This tradition, which has developed over one-hundred years of Jewish agriculture in Israel, is the farmers’ fertile land and cultural heritage that ultimately created Israel’s modern-day, innovative start-up nature.
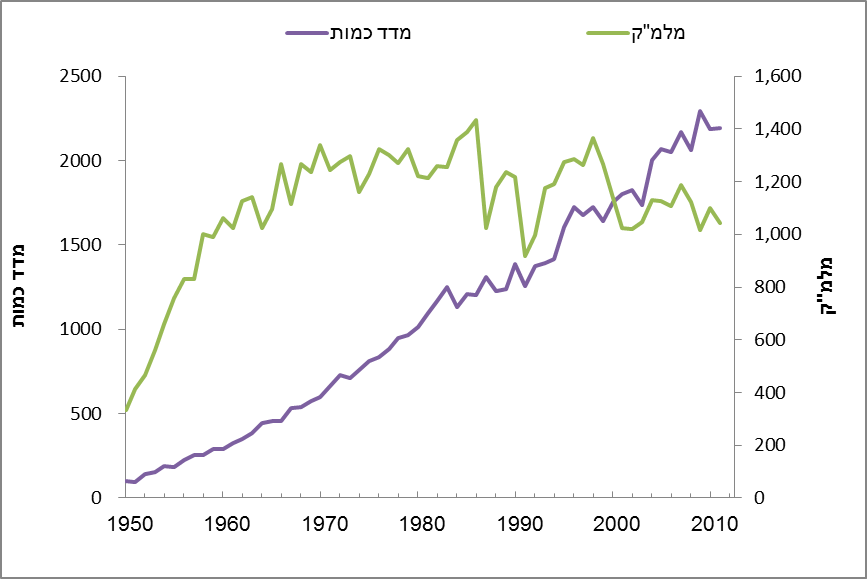
Over the years, farmers in Israel learned how to make the most of every square inch of land and every drop of water. They suited the crops to changing needs. The graph below shows water quantities used for agriculture: since the peak in the mid-1980s when 1.4 billion cubic meters of water were used for irrigation, the industry has consistently streamlined its water usage and we are currently approaching only one billion cubic meters per year, most of which is recycled wastewater. On the other hand, it is clear from the graph that as water usage declines, the agricultural produce index rises consistently, particularly during years when water supplies were more limited.
Agricultural water usage vs. increasing produce quantity indices
(*) The graphs were taken from the Statistical Atlas of Israeli Agriculture, published after years of research conducted by Prof. Yoav Kislev, particularly using data from the Central Bureau of Statistics and updated evaluation of the data with Zenovar.
Categories
Economic History
Quantitative & Qualitative Surveys

